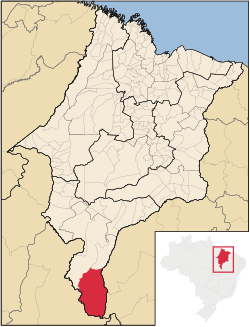
Municipality in Northeast, Brazil
Alto Parnaíba is a Brazilian municipality in the southernmost tip of the state of Maranhão . In 2020, the city's population was 11,212.
The municipality contains part of the 724,324 hectares (1,789,840 acres) Nascentes do Rio Parnaíba National Park , created in 2002.[ 3]
Climate
Alto Parnaíba experiences a tropical savanna climate (Köppen : Aw ) with hot temperatures and distinct wet and dry seasons.
The city experiences a wet season from November to April. The dry season extends from May to September, with June through August having almost no rainfall.[ 4]
Alto Parnaíba has hot and humid conditions throughout the year. September and October, before the wet season, are the hottest months, with average highs around 36 °C (97 °F).[ 4]
Climate data for Alto Parnaíba (1991–2020)
Month
Jan
Feb
Mar
Apr
May
Jun
Jul
Aug
Sep
Oct
Nov
Dec
Year
Mean daily maximum °C (°F)
32.0
32.0
32.2
32.7
33.2
33.3
33.8
35.3
36.7
35.8
33.5
32.4
33.6
Daily mean °C (°F)
26.0
25.9
26.1
26.3
26.1
25.0
24.7
25.8
27.9
28.3
27.1
26.4
26.3
Mean daily minimum °C (°F)
21.9
21.9
22.0
21.8
20.7
18.2
17.0
17.5
20.2
22.3
22.4
22.1
20.7
Average precipitation mm (inches)
231.0
195.7
241.6
128.4
39.6
2.5
0.4
2.0
14.1
74.8
163.8
186.3
1,280.2
Average precipitation days (≥ 1.0 mm)
16.3
15.4
15.9
10.9
4.0
0.4
0.1
0.3
1.8
6.7
11.5
13.5
96.8
Average relative humidity (%)
81.0
82.2
82.5
79.5
74.2
68.3
63.4
58.3
56.7
64.4
75.2
78.6
72.0
Average dew point °C (°F)
22.8
22.9
23.1
22.9
21.9
19.9
18.4
18.1
19.2
21.2
22.5
22.7
21.3
Mean monthly sunshine hours
165.4
142.5
165.7
189.4
240.5
274.8
298.2
288.6
252.9
222.2
173.8
163.0
2,577
Source: NOAA [ 4]
References
Centro Maranhense
Alto Mearim e Grajaú Médio Mearim Presidente Dutra
Leste Maranhense
Baixo Parnaíba Caxias Chapadas do Chapadinha Codó Coelho Neto
Norte Maranhense
Aglomeração Urbana Baixada Maranhense Itapecuru Mirim Lençois Maranhenses Litoral Ocidental Rosário
Sul Maranhense
Chapadas das Mangabeiras Gerais de Balsas Porto Franco


