List of municipalities in Delaware
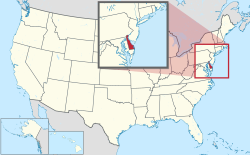
Map of the United States with Delaware highlighted Delaware is a state located in the Southern United States . According to the 2016 United States Census estimate, Delaware is the 6th least populous state with 989,948 inhabitants but the 2nd smallest by land area spanning 1,948.54 square miles (5,046.7 km2 ) of land.[ 1] [ 2] [ 3]
As of 2020, the largest municipality by population in Delaware is Wilmington with 70,898 residents, while the largest by area is Dover which spans 23.668 sq mi (61.30 km2 ). The smallest municipality by both measurements is Hartly with 73 residents in an area of 0.057 sq mi (0.15 km2 ).
List of municipalities
Name
Type
County(ies) [ 2] Population
(2020)[ 4]
Population
(2010)
Change
Land area
(2020)[ 5]
Population density
Incorporated[ 6]
sq mi
km2
Arden
Village
New Castle
430
439
−2.1%
0.249
0.64
2 )
December 22, 1965
Ardencroft
Village
New Castle
226
231
−2.2%
0.089
0.23
2 )
July 7, 1976
Ardentown
Village
New Castle
255
264
−3.4%
0.234
0.61
2 )
June 30, 1975
Bellefonte
Town
New Castle
1,225
1,193
+2.7%
0.177
0.46
2 )
March 9, 1915
Bethany Beach
Town
Sussex
954
1,060
−10.0%
1.148
2.97
2 )
March 29, 1909
Bethel
Town
Sussex
239
171
+39.8%
0.440
1.14
2 )
April 4, 1907
Blades
Town
Sussex
1,179
1,241
−5.0%
0.556
1.44
2 )
March 10, 1915
Bowers
Town
Kent
278
335
−17.0%
0.311
0.81
2 )
March 9, 1907
Bridgeville
Town
Sussex
2,568
2,048
+25.4%
4.821
12.49
2 )
March 29, 1871
Camden
Town
Kent
3,715
3,464
+7.2%
3.746
9.70
2 )
1852
Cheswold
Town
Kent
1,923
1,380
+39.3%
1.838
4.76
2 )
1856
Clayton
Town
Kent New Castle
3,961
2,918
+35.7%
1.948
5.05
2 )
1887
Dagsboro
Town
Sussex
870
805
+8.1%
1.438
3.72
2 )
February 9, 1899
Delaware City
City
New Castle
1,885
1,695
+11.2%
1.861
4.82
2 )
1851
Delmar
Town
Sussex
2,027
1,597
+26.9%
1.901
4.92
2 )
March 9, 1899
Dewey Beach
Town
Sussex
353
341
+3.5%
0.331
0.86
2 )
June 29, 1981
Dover ‡
City
Kent
39,403
36,047
+9.3%
23.668
61.30
2 )
1829
Ellendale
Town
Sussex
487
381
+27.8%
0.425
1.10
2 )
March 30, 1905
Elsmere
Town
New Castle
6,229
6,131
+1.6%
0.987
2.56
2 )
March 9, 1909
Farmington
Town
Kent
92
110
−16.4%
0.073
0.19
2 )
March 15, 1909
Felton
Town
Kent
1,316
1,298
+1.4%
0.782
2.03
2 )
February 21, 1861
Fenwick Island
Town
Sussex
343
379
−9.5%
0.331
0.86
2 )
July 8, 1953
Frankford
Town
Sussex
790
847
−6.7%
0.729
1.89
2 )
1883
Frederica
Town
Kent
1,073
774
+38.6%
1.741
4.51
2 )
1826
Georgetown †
Town
Sussex
7,134
6,422
+11.1%
5.022
13.01
2 )
March 2, 1869
Greenwood
Town
Sussex
990
973
+1.7%
0.794
2.06
2 )
March 9, 1901
Harrington
City
Kent
3,774
3,562
+6.0%
2.724
7.06
2 )
March 23, 1869
Hartly
Town
Kent
73
74
−1.4%
0.057
0.15
2 )
March 23, 1869
Henlopen Acres
Town
Sussex
139
122
+13.9%
0.255
0.66
2 )
June 4, 1970
Houston
Town
Kent
381
374
+1.9%
0.383
0.99
2 )
March 26, 1913
Kenton
Town
Kent
215
261
−17.6%
0.176
0.46
2 )
1887
Laurel
Town
Sussex
3,865
3,708
+4.2%
2.766
7.16
2 )
April 13, 1883
Leipsic
Town
Kent
178
183
−2.7%
0.297
0.77
2 )
February 26, 1852
Lewes
City
Sussex
3,303
2,747
+20.2%
4.192
10.86
2 )
February 2, 1818
Little Creek
Town
Kent
195
224
−12.9%
0.099
0.26
2 )
1899
Magnolia
Town
Kent
277
225
+23.1%
0.196
0.51
2 )
April 3, 1885
Middletown
Town
New Castle
23,192
18,871
+22.9%
12.496
32.36
2 )
February 12, 1861
Milford
City
Sussex Kent
11,190
9,559
+17.1%
9.853
25.52
2 )
February 5, 1807
Millsboro
Town
Sussex
6,863
3,877
+77.0%
5.110
13.23
2 )
March 9, 1893
Millville
Town
Sussex
1,825
544
+235.5%
2.552
6.61
2 )
April 11, 1907
Milton
Town
Sussex
3,291
2,576
+27.8%
1.786
4.63
2 )
March 17, 1865
New Castle
City
New Castle
5,551
5,285
+5.0%
3.478
9.01
2 )
February 25, 1875
Newark
City
New Castle
30,601
31,454
−2.7%
9.427
24.42
2 )
1758
Newport
Town
New Castle
910
1,055
−13.7%
0.466
1.21
2 )
April 17, 1873
Ocean View
Town
Sussex
2,636
1,882
+40.1%
2.773
7.18
2 )
April 13, 1889
Odessa
Town
New Castle
366
364
+0.5%
0.507
1.31
2 )
April 4, 1873
Rehoboth Beach
City
Sussex
1,108
1,327
−16.5%
1.175
3.04
2 )
March 19, 1891
Seaford
City
Sussex
7,957
6,928
+14.9%
5.092
13.19
2 )
April 6, 1865
Selbyville
Town
Sussex
2,878
2,167
+32.8%
3.582
9.28
2 )
March 16, 1901
Slaughter Beach
Town
Sussex
218
207
+5.3%
1.419
3.68
2 )
1931
Smyrna
Town
Kent New Castle
12,883
10,023
+28.5%
6.237
16.15
2 )
1859
South Bethany
Town
Sussex
451
449
+0.4%
0.503
1.30
2 )
June 18, 1969
Townsend
Town
New Castle
2,717
2,049
+32.6%
1.036
2.68
2 )
April 3, 1885
Viola
Town
Kent
140
157
−10.8%
0.177
0.46
2 )
1913
Wilmington †
City
New Castle
70,898
70,851
+0.1%
10.895
28.22
2 )
1739
Woodside
Town
Kent
190
181
+5.0%
0.168
0.44
2 )
April 4, 1911
Wyoming
Town
Kent
1,680
1,313
+28.0%
1.047
2.71
2 )
March 20, 1869
Total municipalities
—
—
279,890
255,143
+9.7% '146.564
379.60
2 )—
Delaware
—
—
989,948
897,934
+10.2% 1,948.0 5,045
2 )—
References


